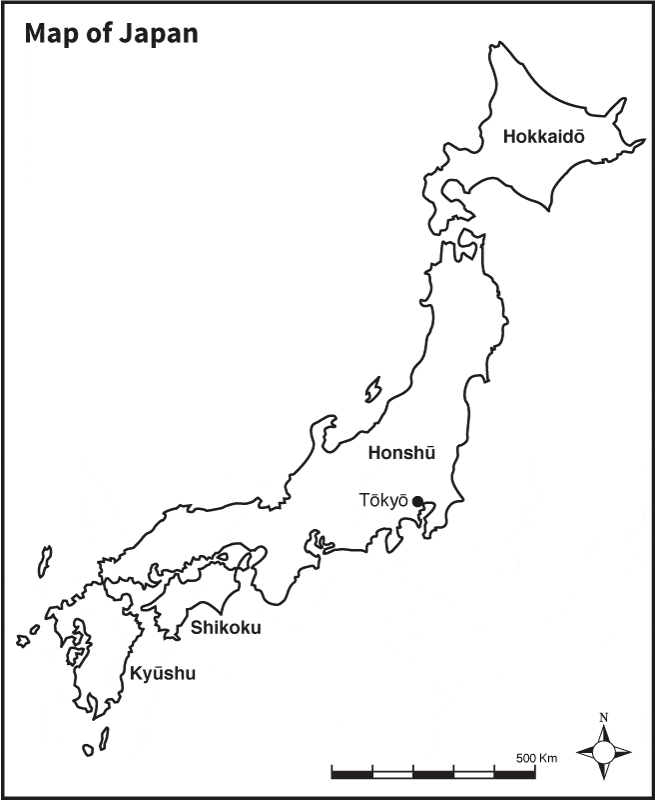
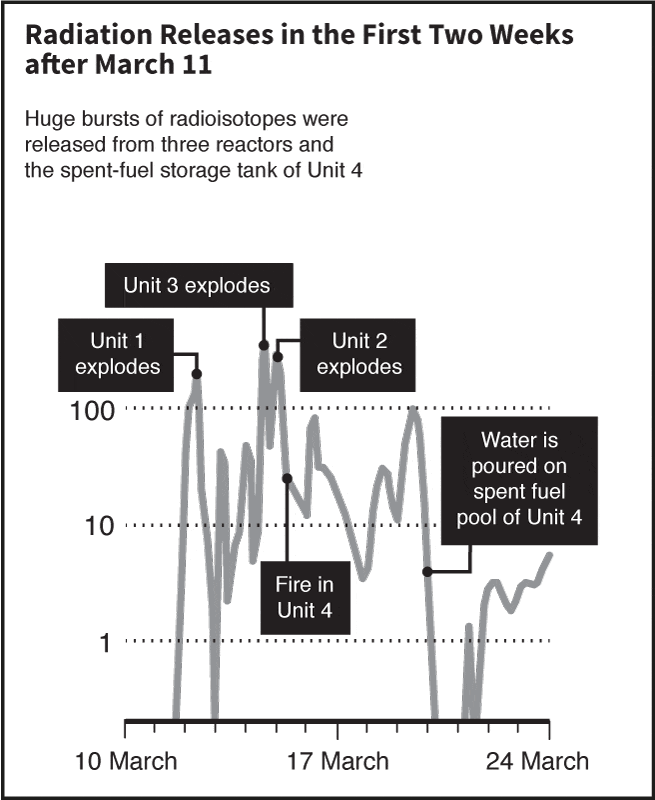
Maps and diagrams from Fukushima and the Coming Tokyo Earthquake, illustrating some of the geographical, seismic, environmental and economic themes discussed in the book.
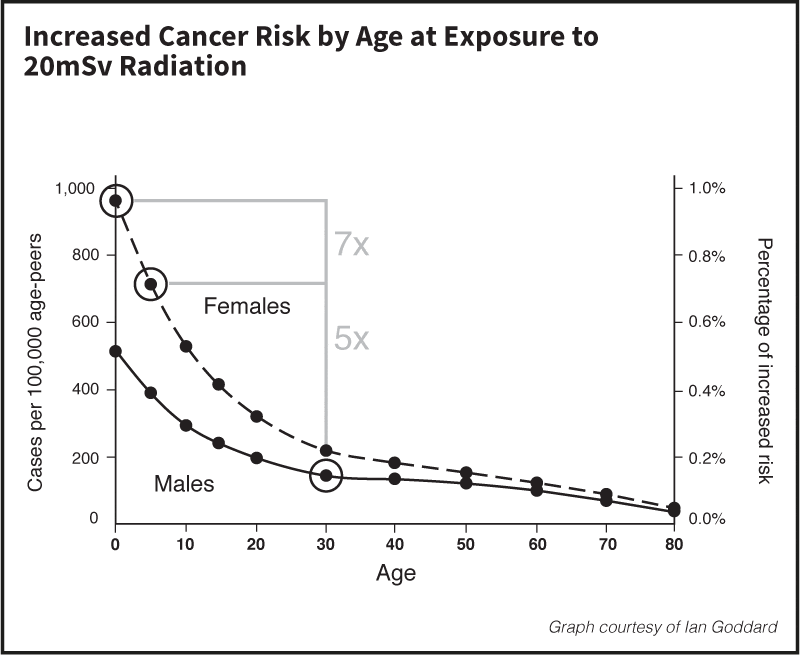
The book discusses the Linear No-Threshold (LNT) model and its application to a 20 millisievert radiation dose exposure. The diagram illustrates the differences in estimated susceptibility to radiation exposure discussed in the book.
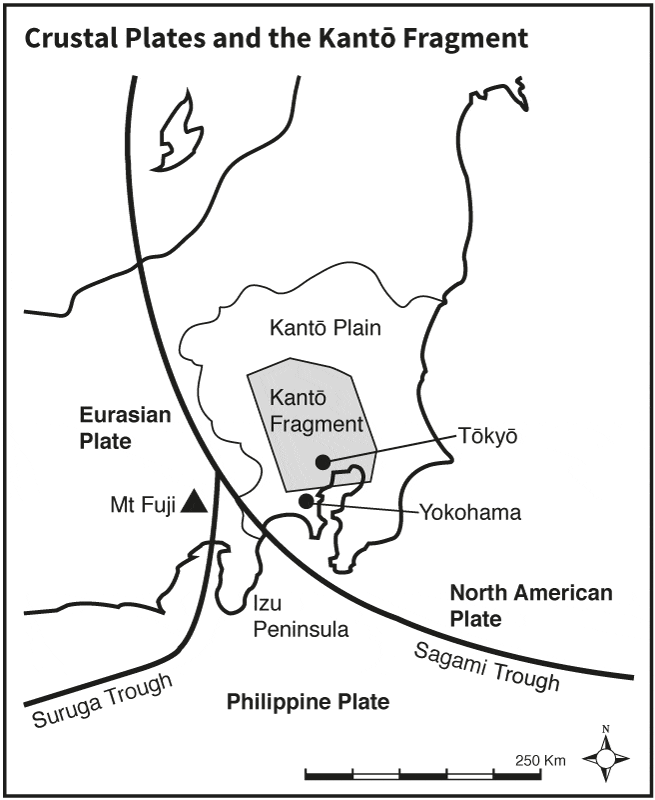
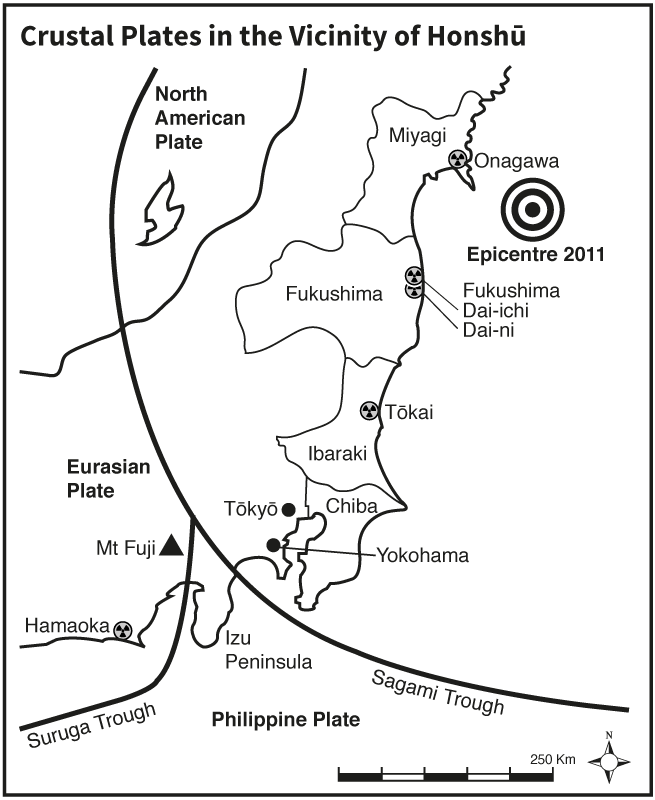
Japan lies in one of the world’s most seismically active regions, where several crustal plates meet around the Japanese Archipelago.
This diagram illustrates the complex geological setting of Japan and the Kanto region, which forms an important part of the book’s discussion of earthquakes and the potential consequences of a major future earthquake affecting Tokyo.
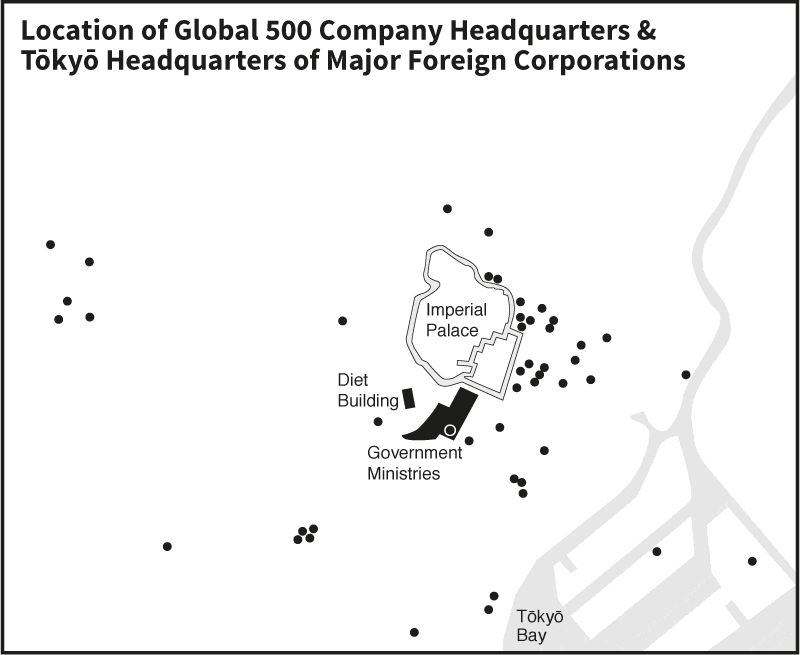
The book examines the concentration of political and economic activity in Tokyo and the Kanto region.
This diagram illustrates the location of major corporate headquarters and other important institutions in central Tokyo, highlighting the concentration of economic and political activity in the capital.